


There is no doubt we live in the age of information. It is estimated that there are 2,5 exabytes of data generated each day. Everyone agrees that collecting, analyzing, and putting data to use equals tremendous advantages in technology, science, and business alike.
Let’s start with the basics though. In this article, we will describe types of data, explain the differences between spatial and non-spatial data, and suggest ways you can use them, also in a business context.
What are spatial data and non-spatial data?
Generally speaking, data can be divided into two categories:
Non-spatial data
answer “what?”
This kind of data is independent of geographic location. They contain information about a particular object but don’t define its location.
Spatial (geospatial) data
answer “where?”
This kind of data contains information about a specific geographic location on the Earth’s surface.
Let’s take a closer look at the spatial data
Spatial data are made of smaller elements just like a water molecule is made of hydrogen and oxygen atoms. Using this analogy, in the case of spatial data there are two data models made of single “atoms”.
Vector data
In the vector data model, points are the ”atoms”. Vector data represents the real world graphically using points, lines, and polygons with specific coordinates. Connecting points create lines and connecting lines create polygons. Vectors present generalizations of physical objects and are most often stored in .shp files (Shapefiles).

Raster data
In the raster data model, pixels are the ”atoms” and data is presented in a grid of pixels. Each pixel within a raster has a particular location and set of attributes. Pixel value represents a color. A common example of raster data is a photograph. However, when it comes to spatial data, rasters typically refer to orthoimagery which are photos taken from aerial devices such as satellites or planes.
Primary spatial data, an uncut gem
Vector and raster data are so-called primary spatial data. They have been collected in the field but they aren’t processed in any way and haven’t been yet put to use.
Secondary spatial data and where you can encounter them
Spatial data that we encounter daily (often without realizing it) are called secondary spatial data. This type of data has already been processed. Let’s see where you can find them.
Everyone encounters this type of spatial data for the first time at elementary school. Typically a long time passes before one realizes why learning to determine the longitude and latitude of Cape Horn is useful beyond the geography class.
A geographic coordinate system is used to identify exact locations on the surface of the Earth, e.g. in smartphone navigation. In mathematical systems, we use an x and y axis and in geography, the axes are referred to as latitude and longitude. Latitude and longitude degrees represent the angle at which the line is oriented to the center of the Earth.
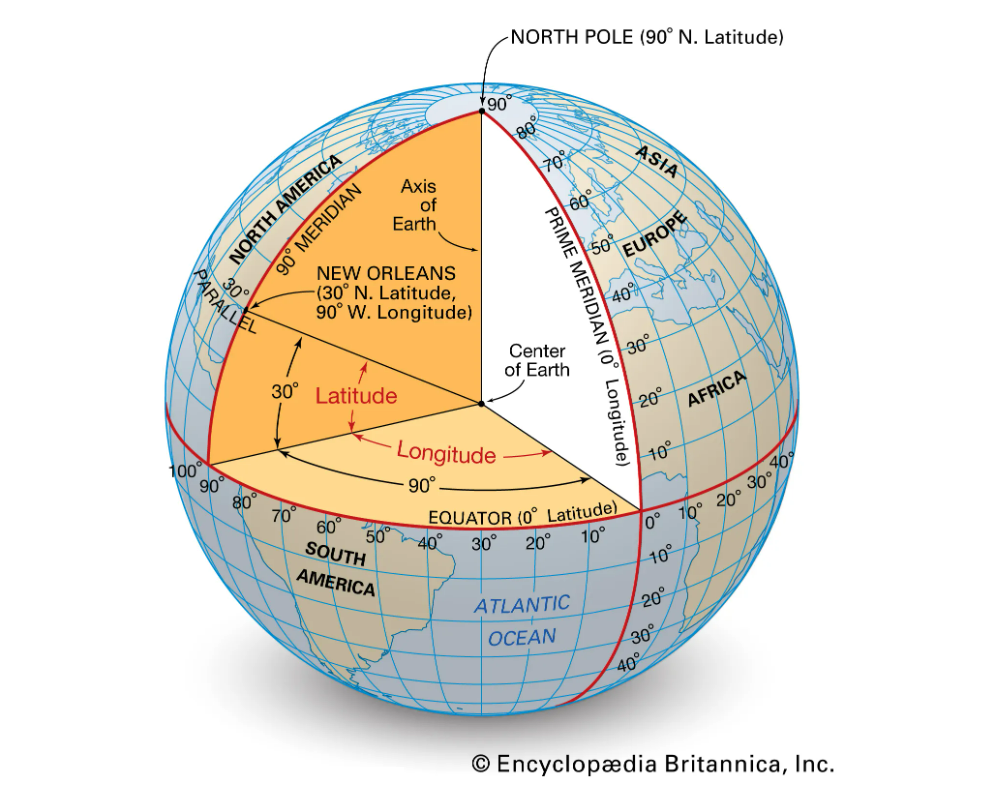
Source: https://www.britannica.com/science/latitude
Georeferencing and geocoding are different but similar processes. Both involve fitting data to the appropriate coordinates.
Georeferencing is a process of assigning coordinates to vectors or rasters so they can be located on the surface of the Earth. Geocoding, on the other hand, is related to giving the address data (e.g. city or country) coordinates of reference for that location.
Both of these mechanisms are used in Google Maps. Georeferencing is whenever you send your friend a location of a particular place that doesn’t have an address. Geocoding is when you enter an address into your smartphone navigation system and it is then transformed into coordinates for the GPS.
LiDAR data are also known as cloud points and they describe an object or a surface. Points are collected using Light Detection and Ranging (LiDAR) laser scanning technique by flashing a point with the laser and measuring the return times for reflected light. As a result, you get distance which can later be translated into a 3D position for creating e.g. a terrain model. 3D data extends the typical 2D latitude and longitude coordinates, as they also contain information about height and depth.
Spatial data can be expanded with any number of additional attributes that carry spatial information about an object beyond its location. Attributes can also be completely unrelated to spatial information.
For example, you can find attributes in the National Tree Crown Map, an inventory of trees in Poland. Besides the location of each tree in the inventory, the map also carries information about their species, age, and height.
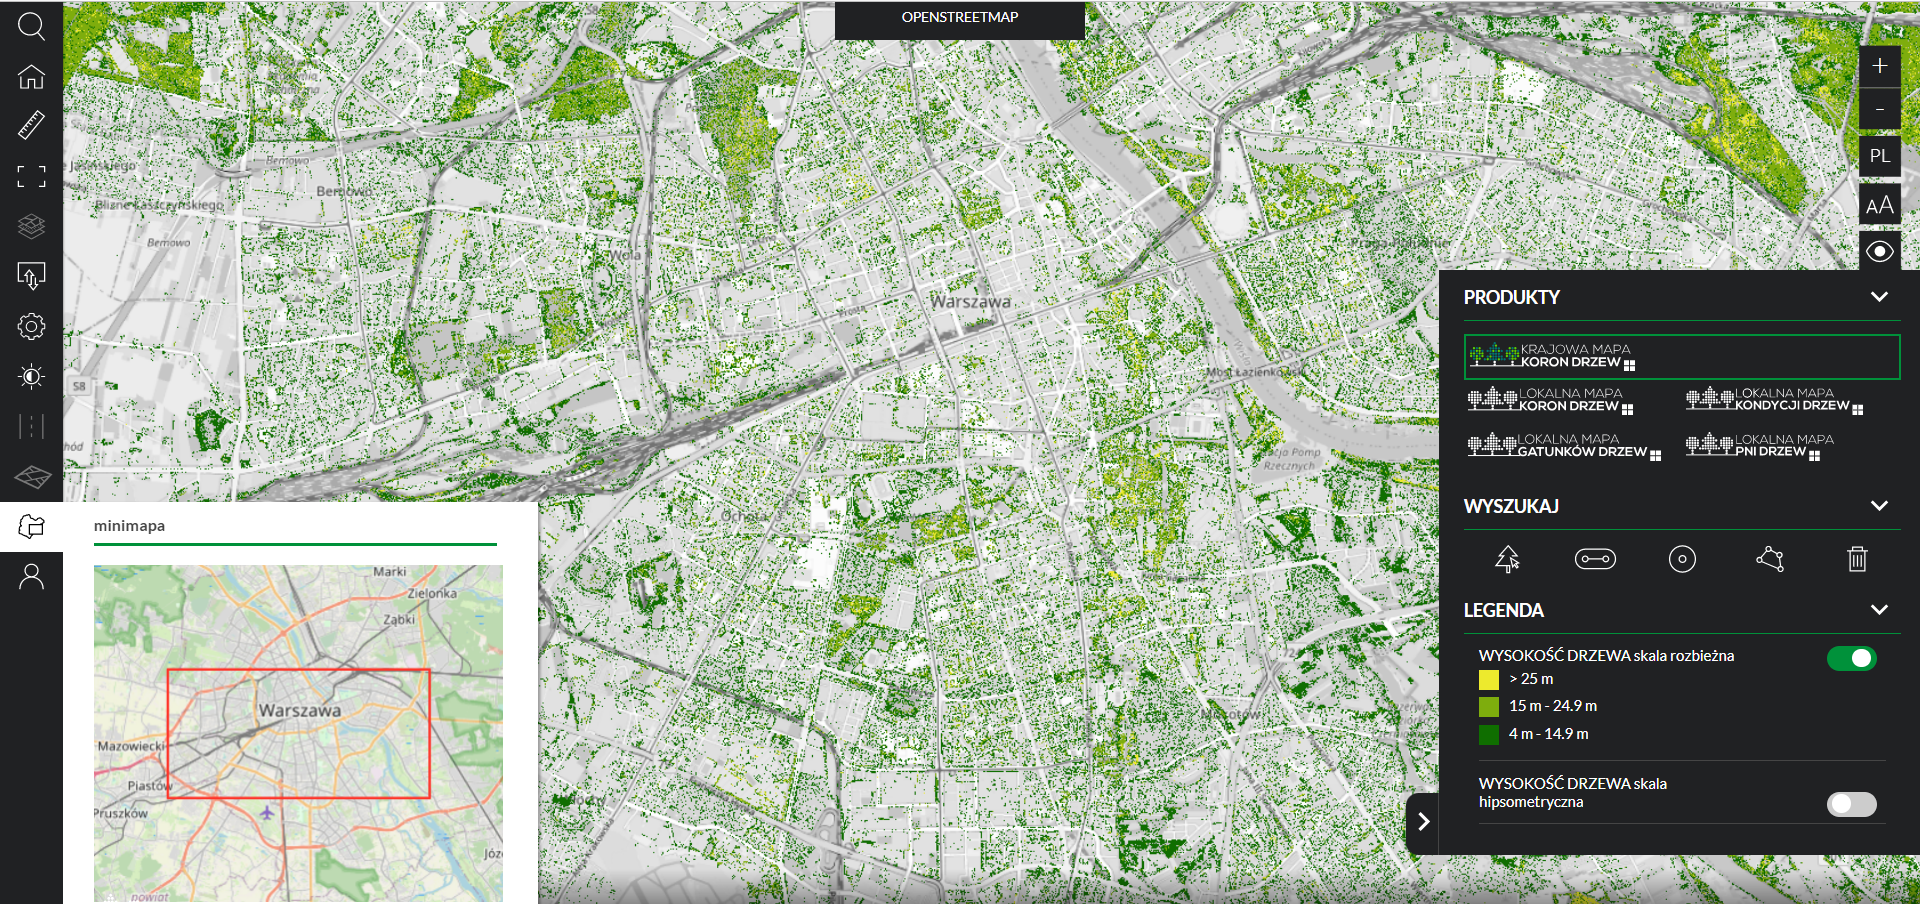
National Tree Crown Map
https://aplikacja.mapadrzew.com/
Why are geospatial data so important?
Location context allows you to use spatial dependencies and gain deeper insight. As a result, you can make better, more informed decisions – also regarding your business. A saying goes that 80% of companies collect and store data that contain geospatial context. Spatial data is used even when you don’t realize it, no matter what’s your industry.
How can you use spatial data (also in the business aspect)?
Now that you have basic knowledge about data types, you surely wonder what’s next and how you can put spatial data to work.
Let’s then move on to some use cases:
GIS (Geographic Information System) is a program or several intertwined programs that allow you to visualize, analyze, and manage data through a map. Such systems are used for visualizing and analyzing network data in many different industries, e.g. energy, district heating, or telecommunications. Thanks to this, networks can be managed efficiently. An example of such a system is GeoGrid created by Globema. It helps to use the full potential of data visualized on maps.
GIS users typically compare and analyze several spatial datasets visualized on separate layers. This allows them to better understand dependencies, monitor processes, and get accurate insights. GIS is the most common way of using spatial data.
Spatial data is commonly presented on maps. Maps can reflect complex issues and help understand different phenomena. Data is easier to interpret on maps, as you can notice consistencies with a quick glance. Therefore, maps help to make quicker, informed decisions.
Maps can be also used for presenting data that typically aren’t visual, such as demographics or correlations, e.g. forecasted temperatures.
An interesting variant is a choropleth map. Such a map presents a phenomenon using its average values within borders of particular territorial units. An example is the average population density per square kilometer in a given county. Another example goes back to the National Tree Crown Map which shows percentages of tree coverage in counties and voivodeships.

Choropleth map of a percentage of tree coverage in each voivodeship on the National Tree Crown Map
Another way of using spatial data is creating a map or a 3D view using an internet visualization library. This lets you share your visualizations using a URL. It can be an interactive map or a data repository – your options are unlimited!
Spatial data analyses allow you to better understand processes and phenomena and therefore make more informed decisions. This is useful in nearly every industry.
By analyzing data about demographics in a spatial context you can choose the best location for investments such as an electric car charging station or a shopping mall. This is location intelligence – a methodology of deriving insights from spatial data to understand different phenomena and improve management and decision-making.
Mapping that uses location can also help fight climate change because it is used for planning better, more optimal transport routes. This results in reduced gas usage, more sensible apportionment of fossil fuels, and limited greenhouse gas emission, including CO2.
Spatial data is common in many industries and can be used for analyzing many different issues. Every day, large amounts of information are being collected but few people know where to search for such data and use them for achieving business goals.
Spatial data presentation goes way beyond well-known maps and GIS offer ways to visualize, process, and analyze processes in nearly every industry: from telecommunications and energy to retail.

So if spatial data keep so much value, why only now have they become such a hot topic? The answer to this question is simple. It is not a secret that spatial data are useful but they used to be way less available. Due to accessibility issues, there weren’t enough of them to perform successful analyses. Increasingly advanced computers and other devices for collecting and processing data make this process way easier. Therefore, companies use spatial data when searching for solutions to their problems and business needs.
Something that still causes an issue in working with data is the fact that they are often trapped in formats hard to read by your applications. Luckily, there are data processing tools such as FME Platform which help to translate spatial data to a format accessible for commonly used applications and use their full potential.