Detecting cable damage is difficult and repairs are costly. SORAL is a System for Identifying Risks of Cable Line Outages; it locates damaged and overly used cables. At the same time, SORAL identifies necessary repairs. This helps avoid failures, lower network maintenance costs, and plan repairs more effectively.
Moving your cable lines under the ground brings many benefits but it also causes troubles related to:
Network maintenance work
Network upgrades and repairs
Outage handling
Then how can you tackle this challenge and access network information necessary for securing your operations?
Introducing SORAL – a system to monitor technical conditions and identify outage risks of medium-voltage cable lines.
SORAL allows network operators to switch from corrective-based maintenance to condition-based maintenance. Using a prevention approach can help minimize the number of outages caused by poor technical network conditions. You significantly lower your network maintenance costs while maintaining the continuity of provided services. This benefits both network operators as well as their clients.
See what network questions SORAL can answer:
Cable line operations
- What are the conditions of lines in particular departments and the entire organization?
- Which cables need more detailed inspections?
- When should you perform the next measurements/inspections of the lines?
Cable line outages
- Which lines are the most prone to outages?
- Which line segments may be at risk of an outage?
- Are any cable segments, couplers, or connectors affected by degradation?
Cable lines modernizations and repairs
- Which lines should be repaired first?
- Which cable segments should be replaced?
- Which lines can be safely used despite their age?
How does SORAL work?
A simple data model
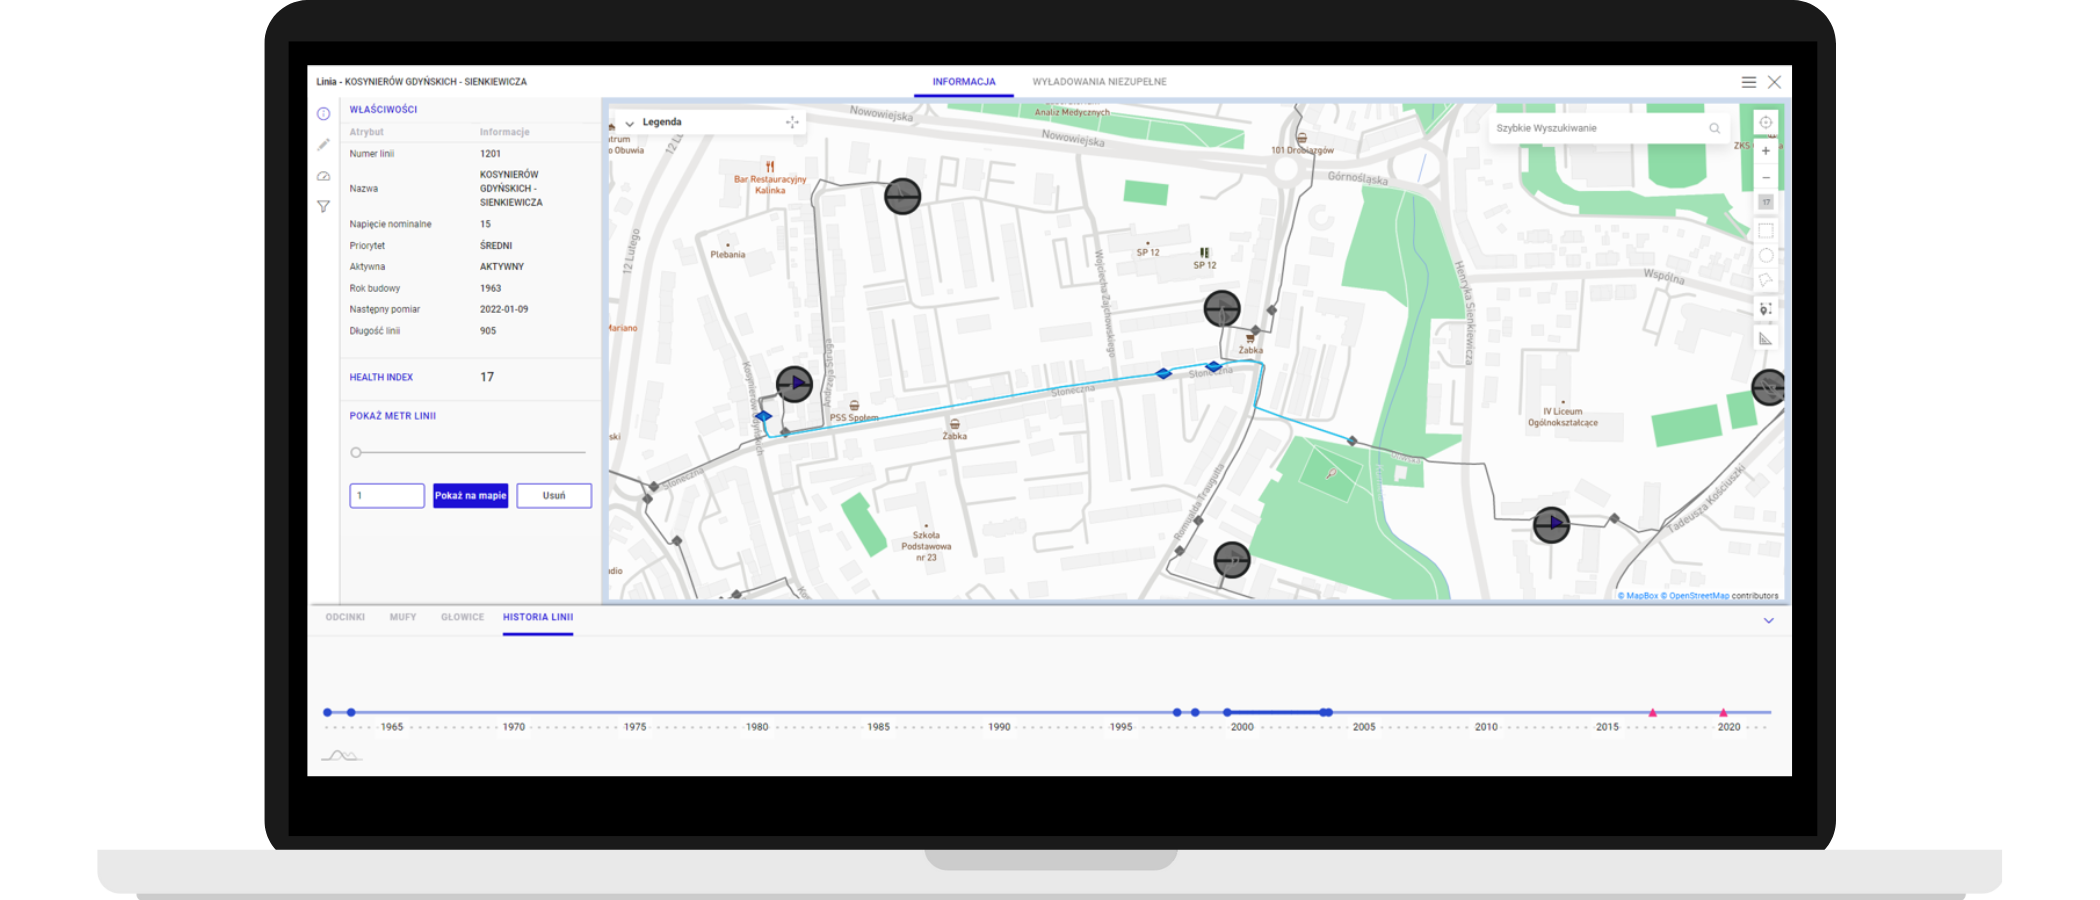
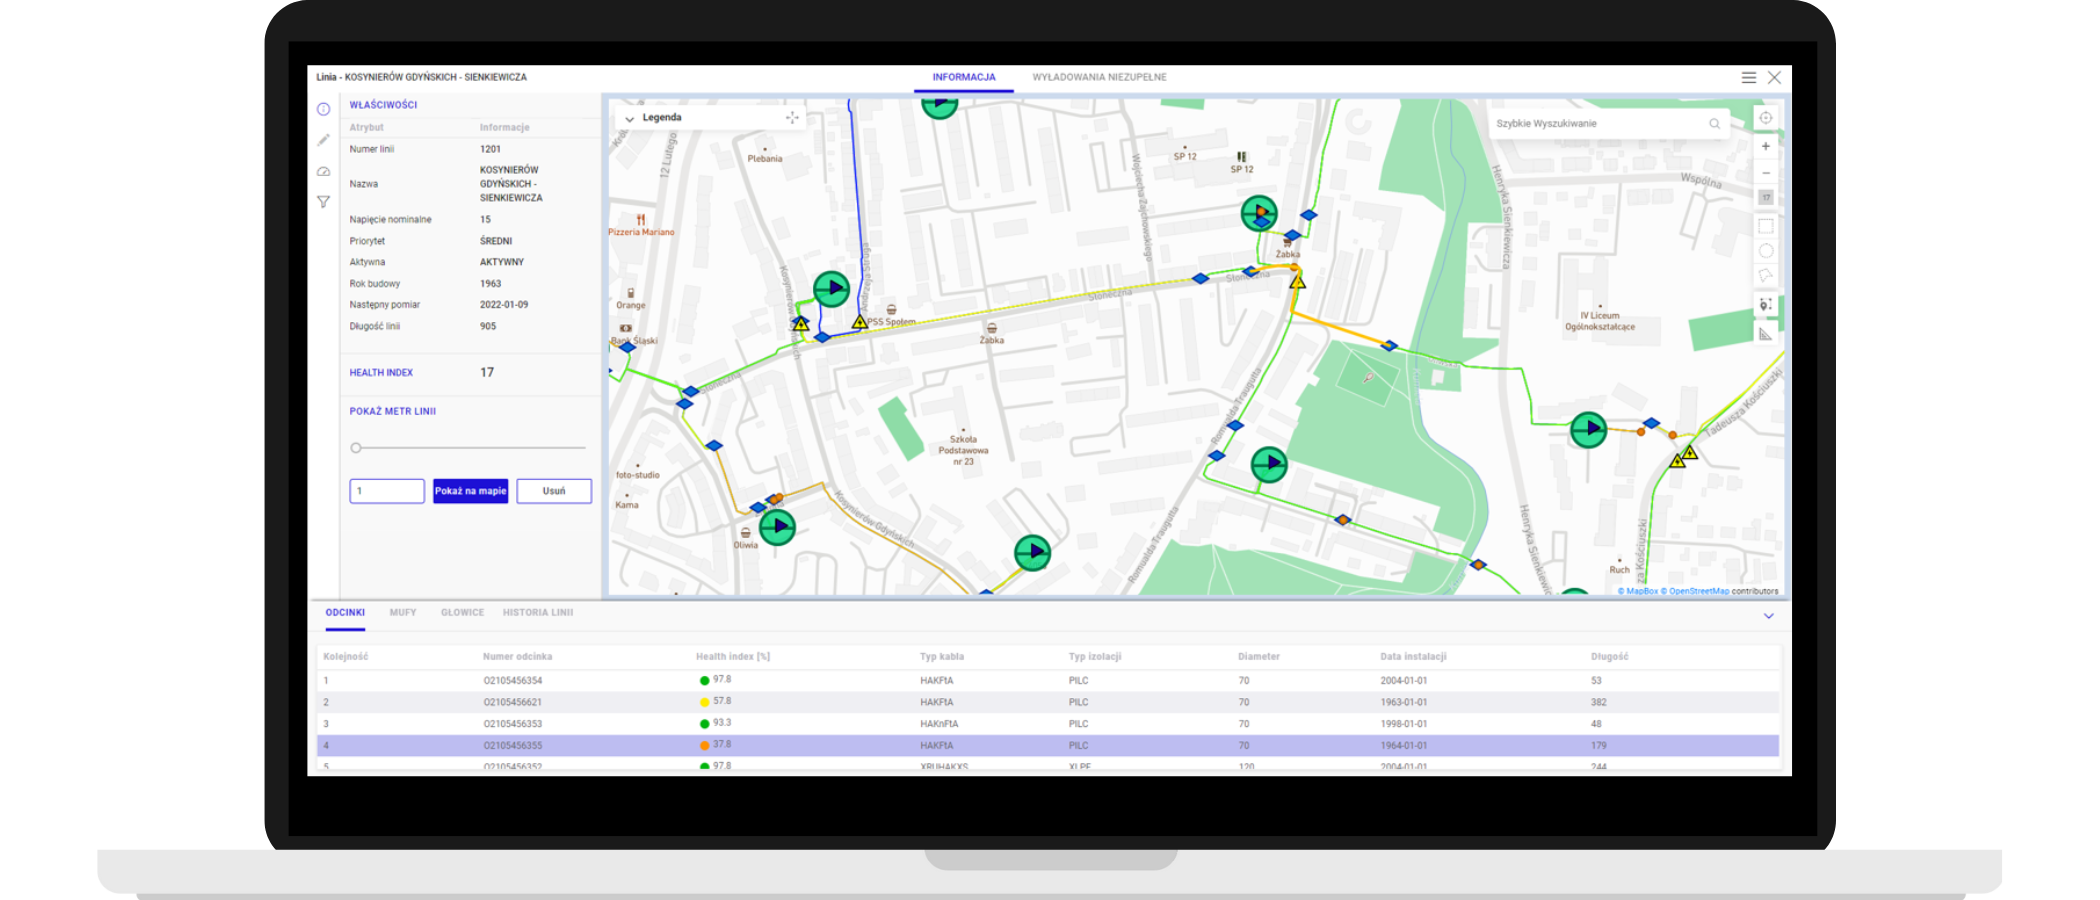
Cable network data models in SORAL include low-voltage stations, cable lines, overhead cable lines, couplers, and connectors. SORAL stores basic technical data about these objects, as well as network event and measurement history. System operators can also enter data about outages and cable capacity directly into the system through its edit mode.

Many data sources
SORAL pulls data from 3 main sources:
GIS systems – technical data and data about network topologies and routes
Measurement vehicles – tan delta testing and partial discharge data
Other sources storing information about outages, cable capacity, voltage tests, and leakage current tests
Data from a GIS system may be loaded into SORAL using Common Information Models (CIMs). Another solution is a data loader built with FME, a tool for data processing and integration. A data loader should be used during the system implementation stage. At this stage, it’s also possible to define additional data sources.
Health Index
Together with Energa, one of the largest Polish distribution network operators, we created Health Index. It’s a classification for technical conditions of particular cable line components. Thanks to standardized classification, Health Index can be a universal tool for identifying outage risks. Health Index is a part of the SORAL solution.
Health Index handles cable segments, couplers, and connectors. Colors represent the technical condition of network components.
It’s based on the analysis of:
- Discharge accumulation
- Discharge voltage
- Discharge amplitude
- Cable age
- Outage history
- Tan delta
Health Index supports different measurement methods and types of insulation.

Support for different diagnostic methods (OWTS/DAC and VLF)
SORAL analyzes technical conditions of cable lines based on many factors, e.g. cable age, cable capacity, outage history, voltage test results, leakage current test results, tan delta test results, and partial discharge data.
Analytic module
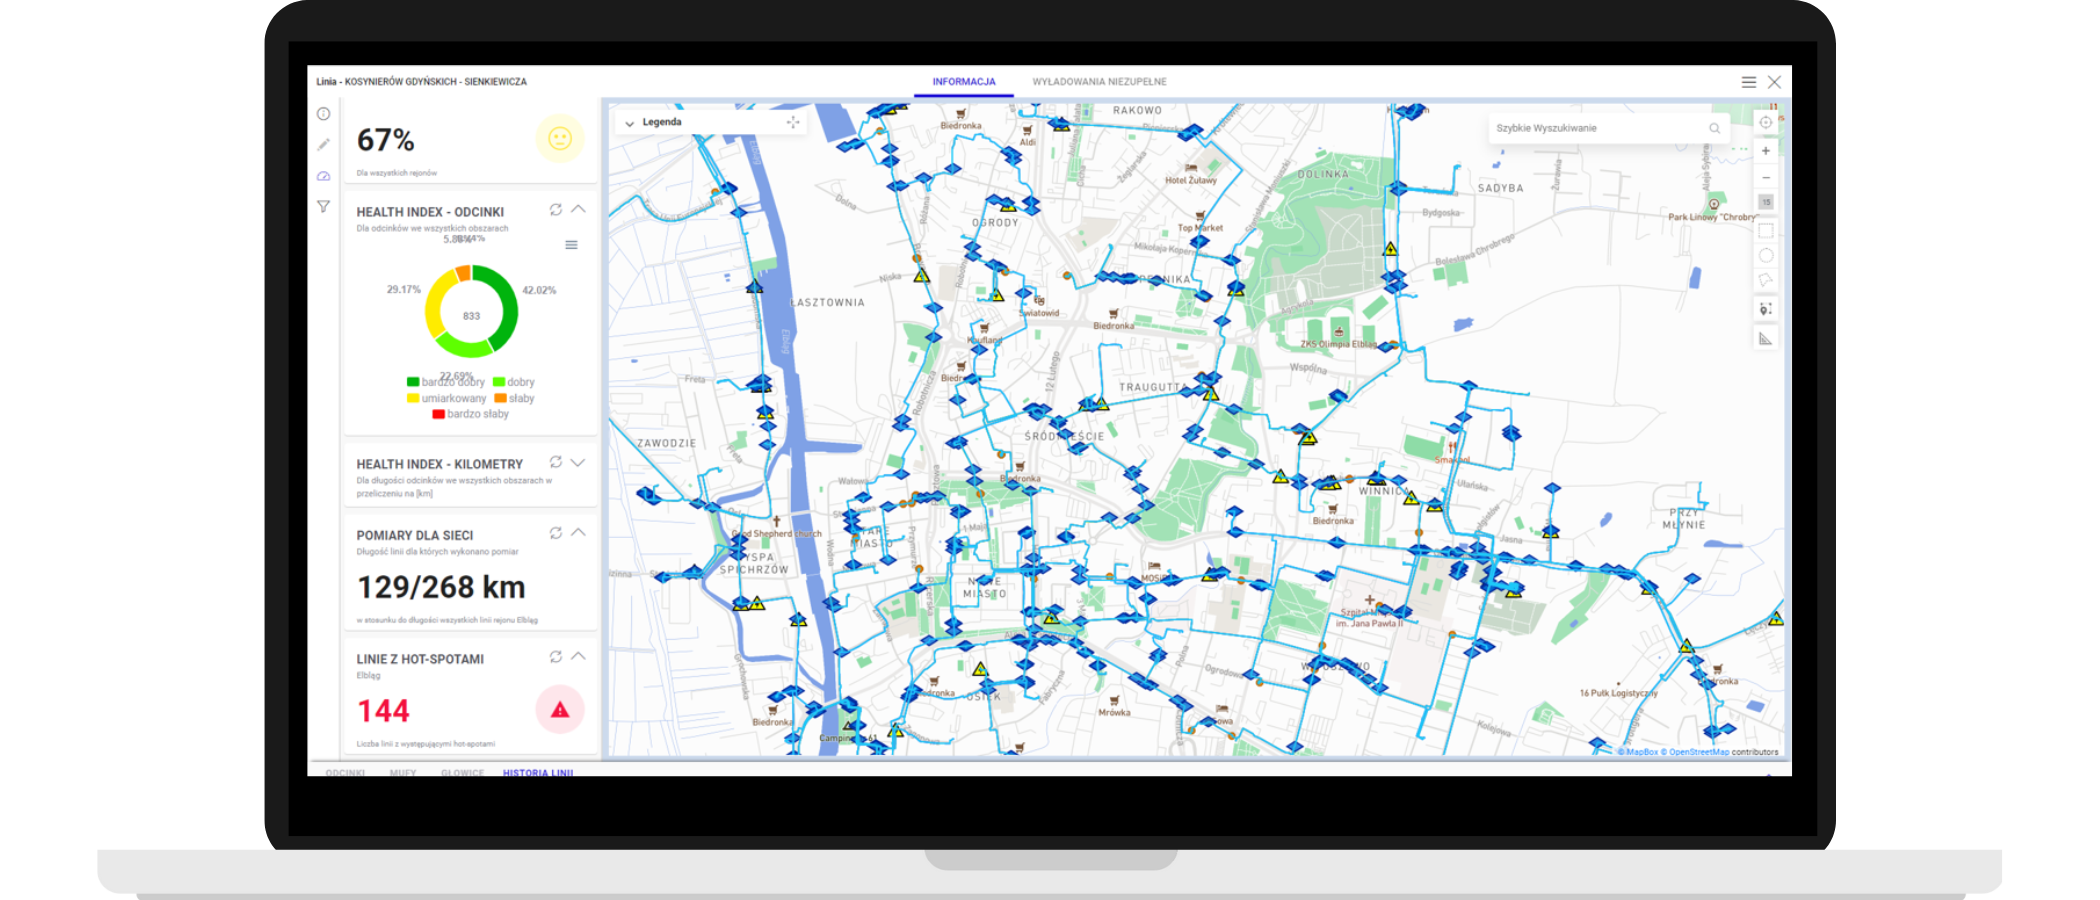
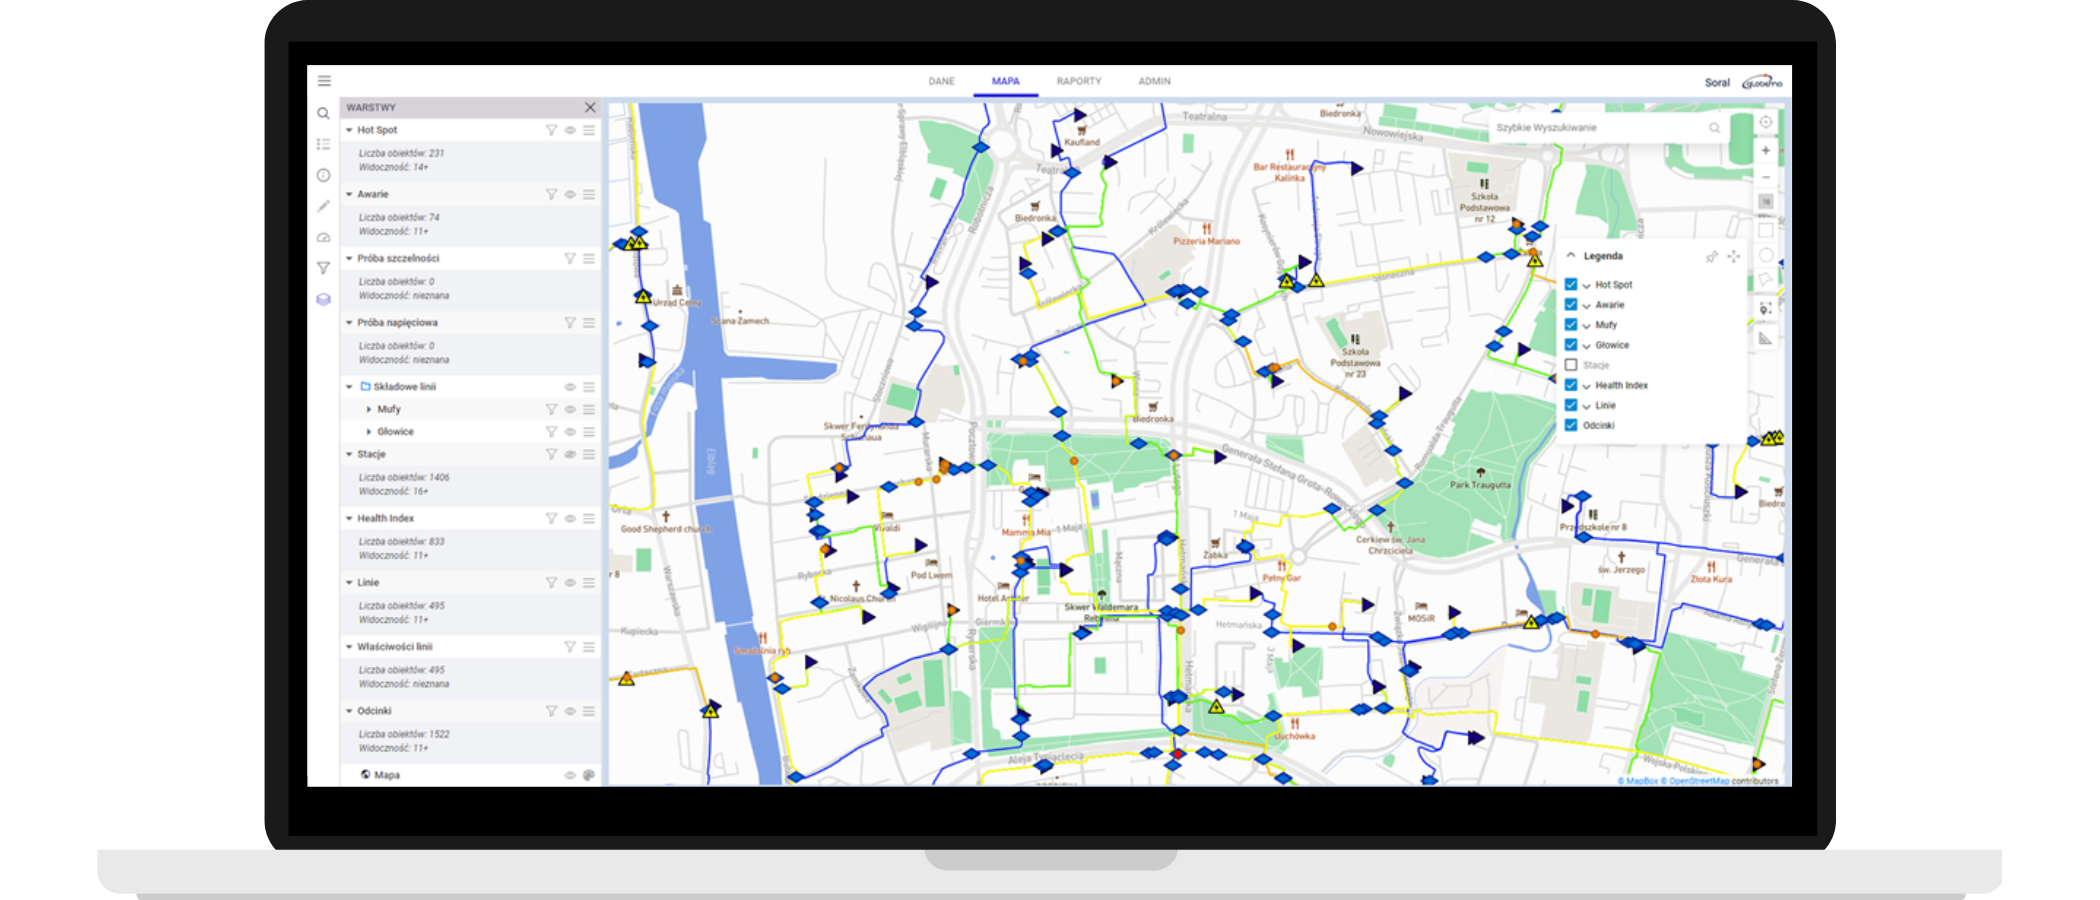
Based on the collected data, SORAL generates reports and charts. It also visualizes the most important factors in diagrams and creates data panels. All of this can be viewed on a map.
What do you gain with SORAL?
The most important diagnostic data all in one place
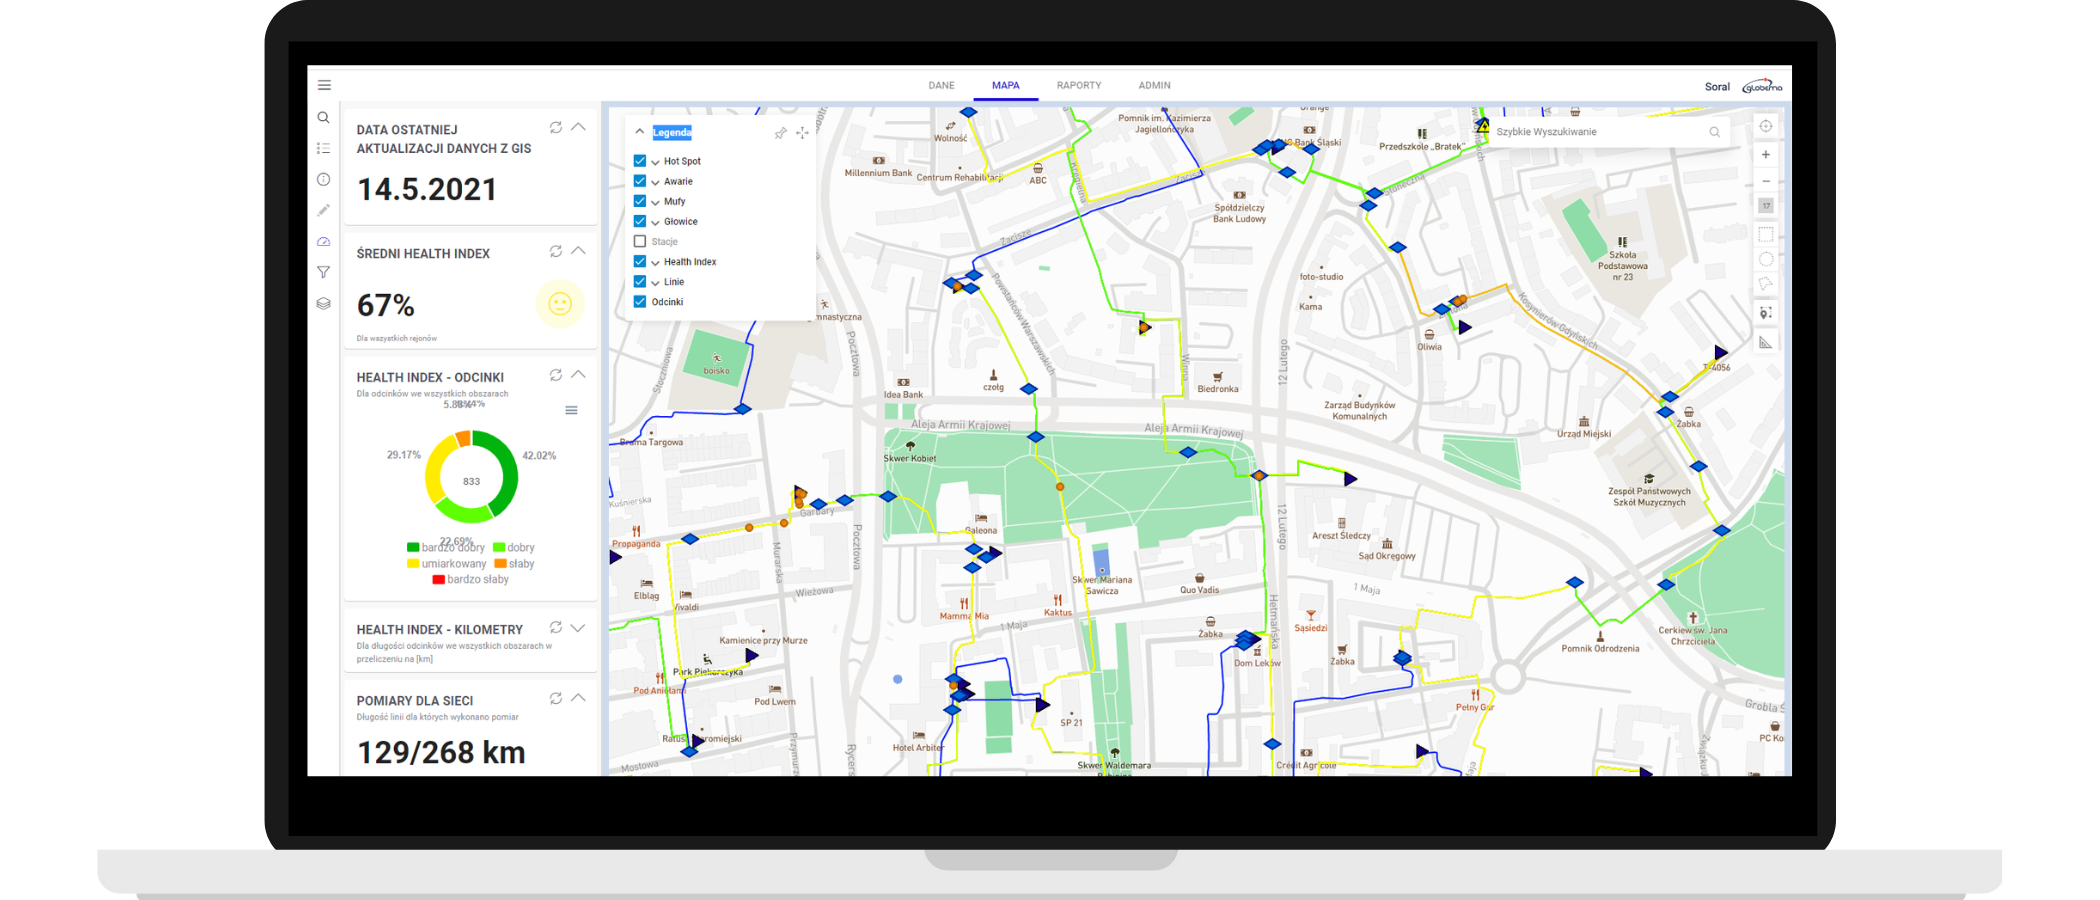
Consolidated data panel
The panel presents the most important parameters reflecting network conditions through charts and statistical data. It provides detailed information about the network divided into particular areas.
Access to the detailed data
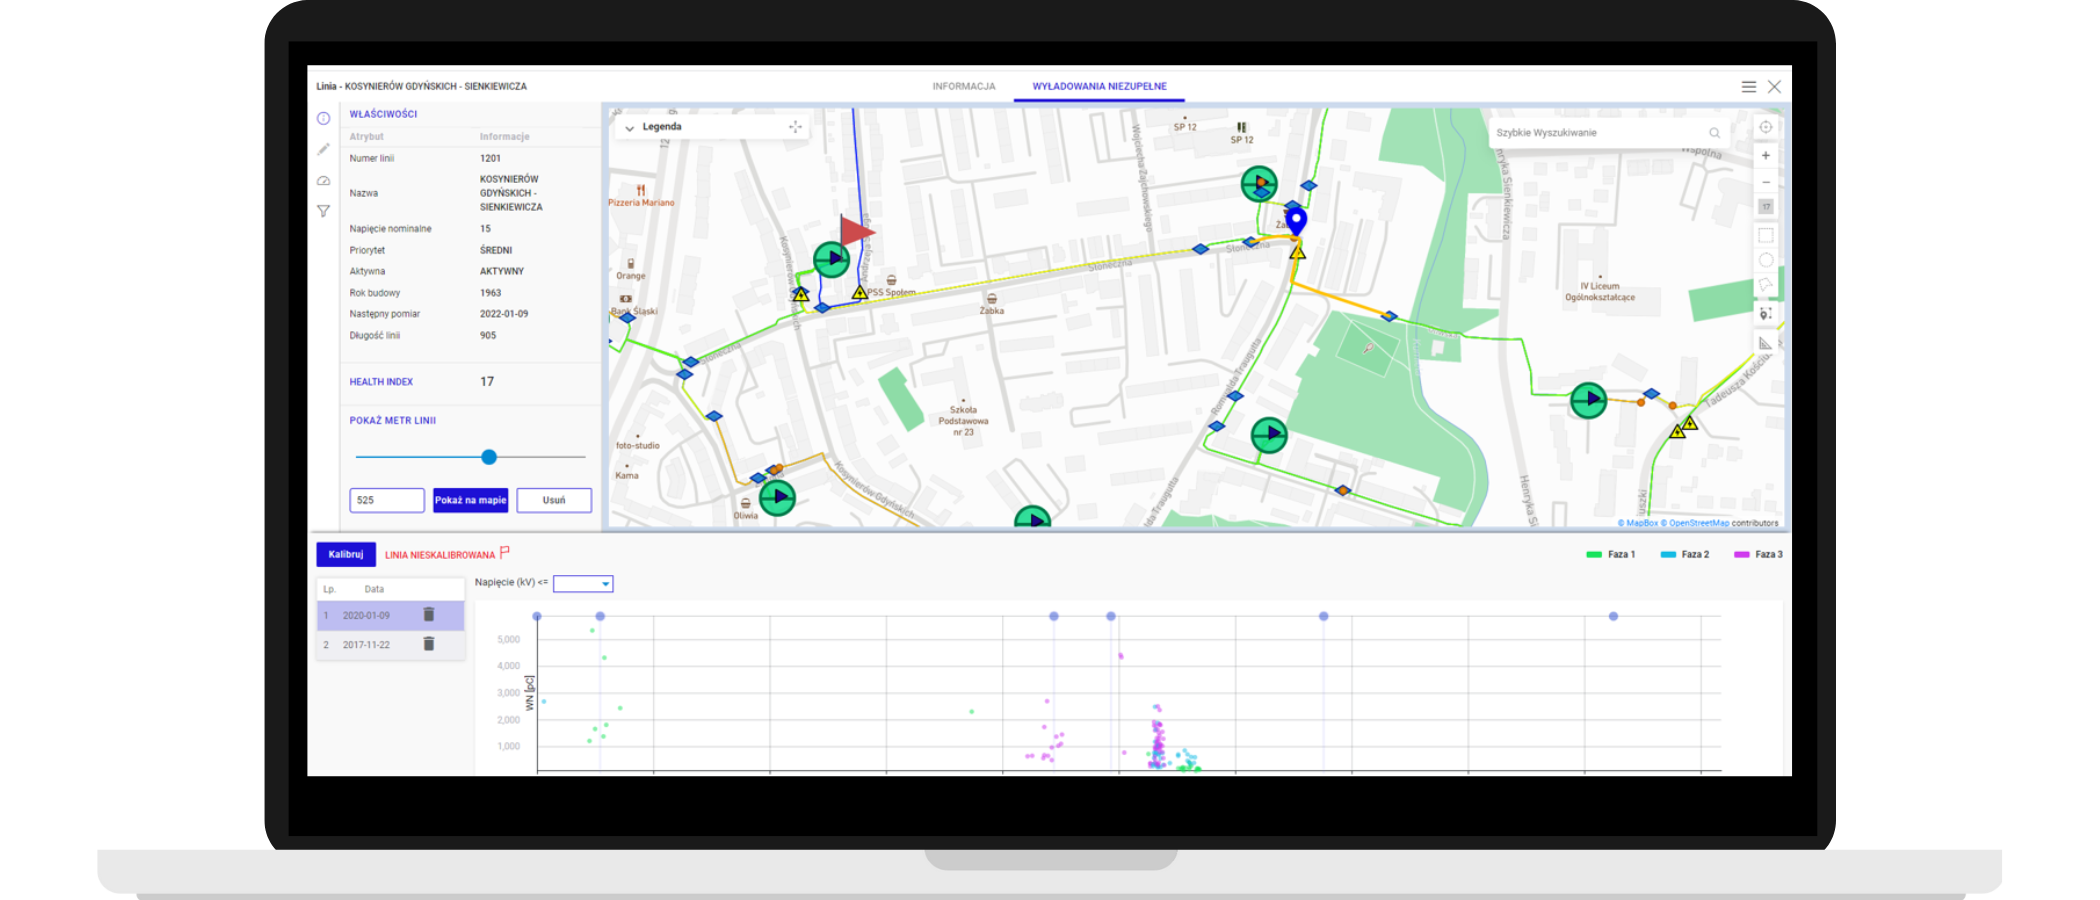
The system stores information about tan delta and partial discharge measurements, changes in cable lines, and outages. This data can be viewed on a timeline. Detailed data can be viewed on a map or in reports generated by SORAL.
Potential outage sites
Potential outage sites (Hot Spots) are marked on a map by the partial discharge analysis. This provides precise information on where technicians need to dig to excavate and replace a network component at risk of an outage.
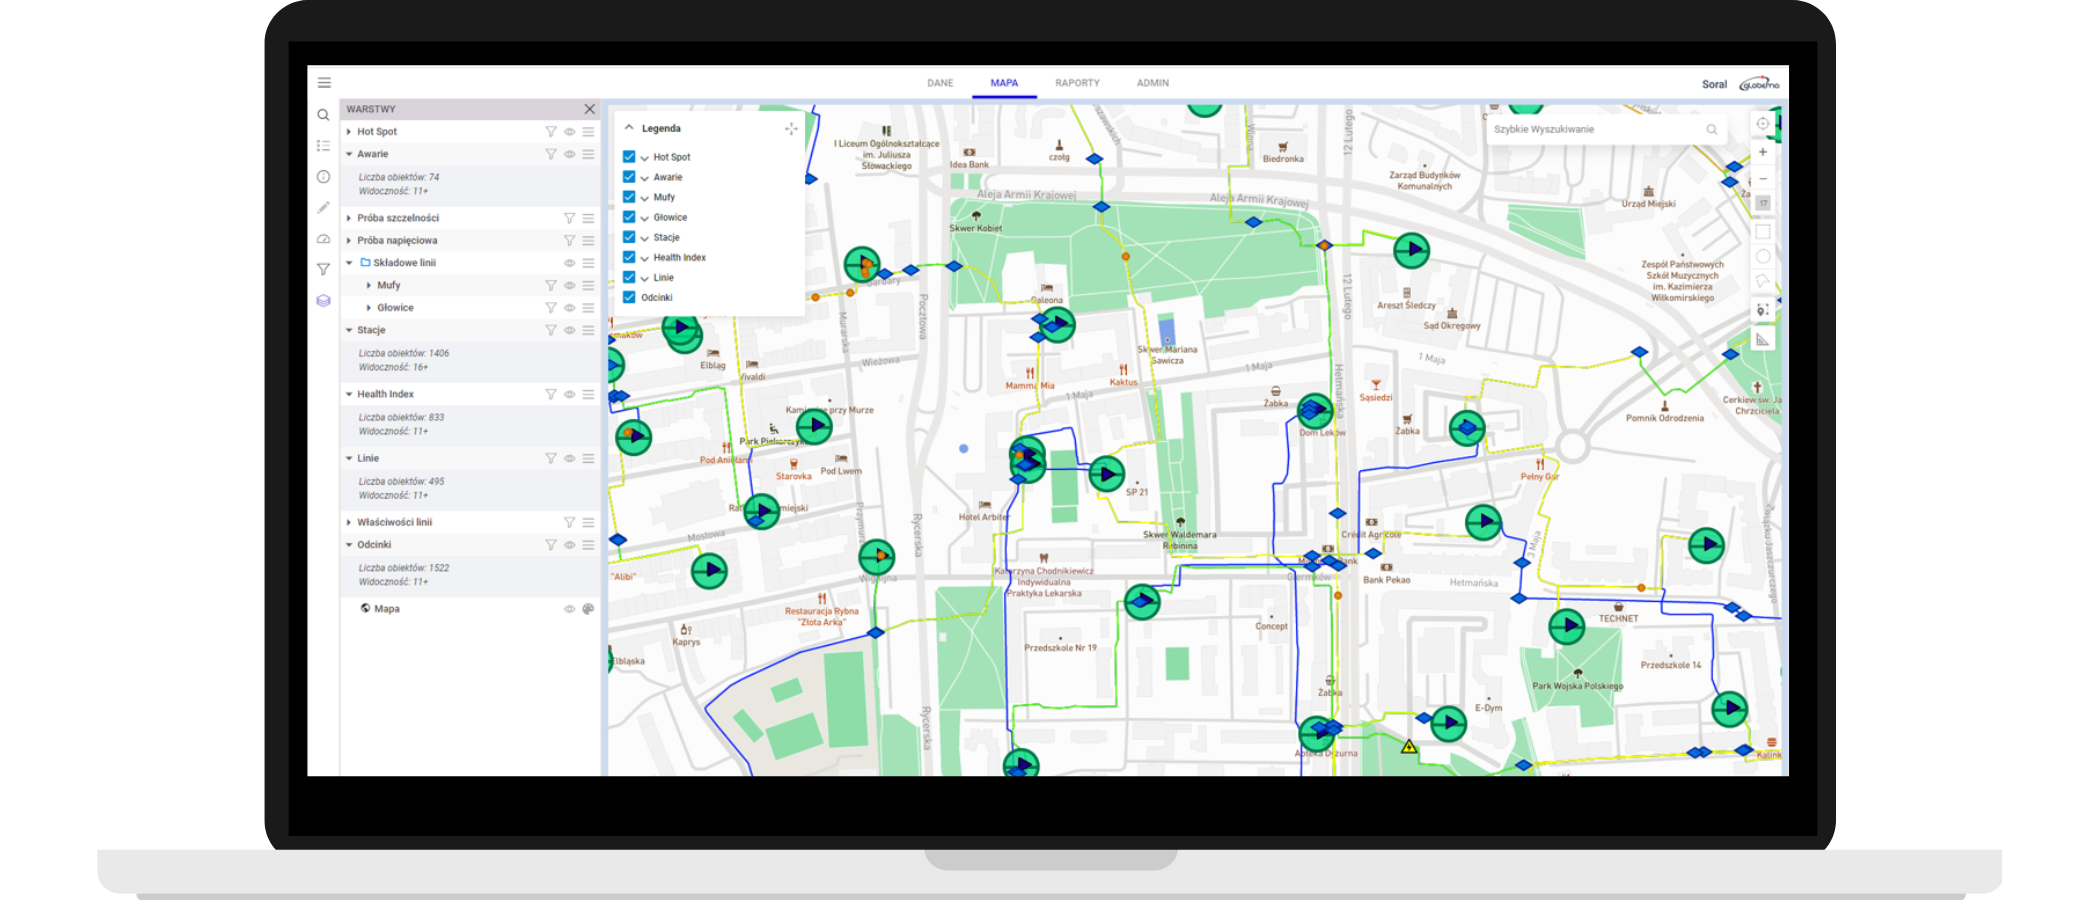
Health Index and the network condition view
The cable line Health Index based on multi-parameter measurements provides a clear view of network conditions. This supports the process of preventing outages. The system identifies network problems that need immediate servicing ensuring that components are only replaced when necessary.
Cables are marked in five different colors depending on the Health Index value. A quick glance is all it takes to see the whole network and identify areas needing technical attention.
Assessing lines in need of repairs
The system provides a clear view of which cables need immediate replacement and which can be serviced in the future. Repairs can be planned to optimize costs by batching work in close proximity.


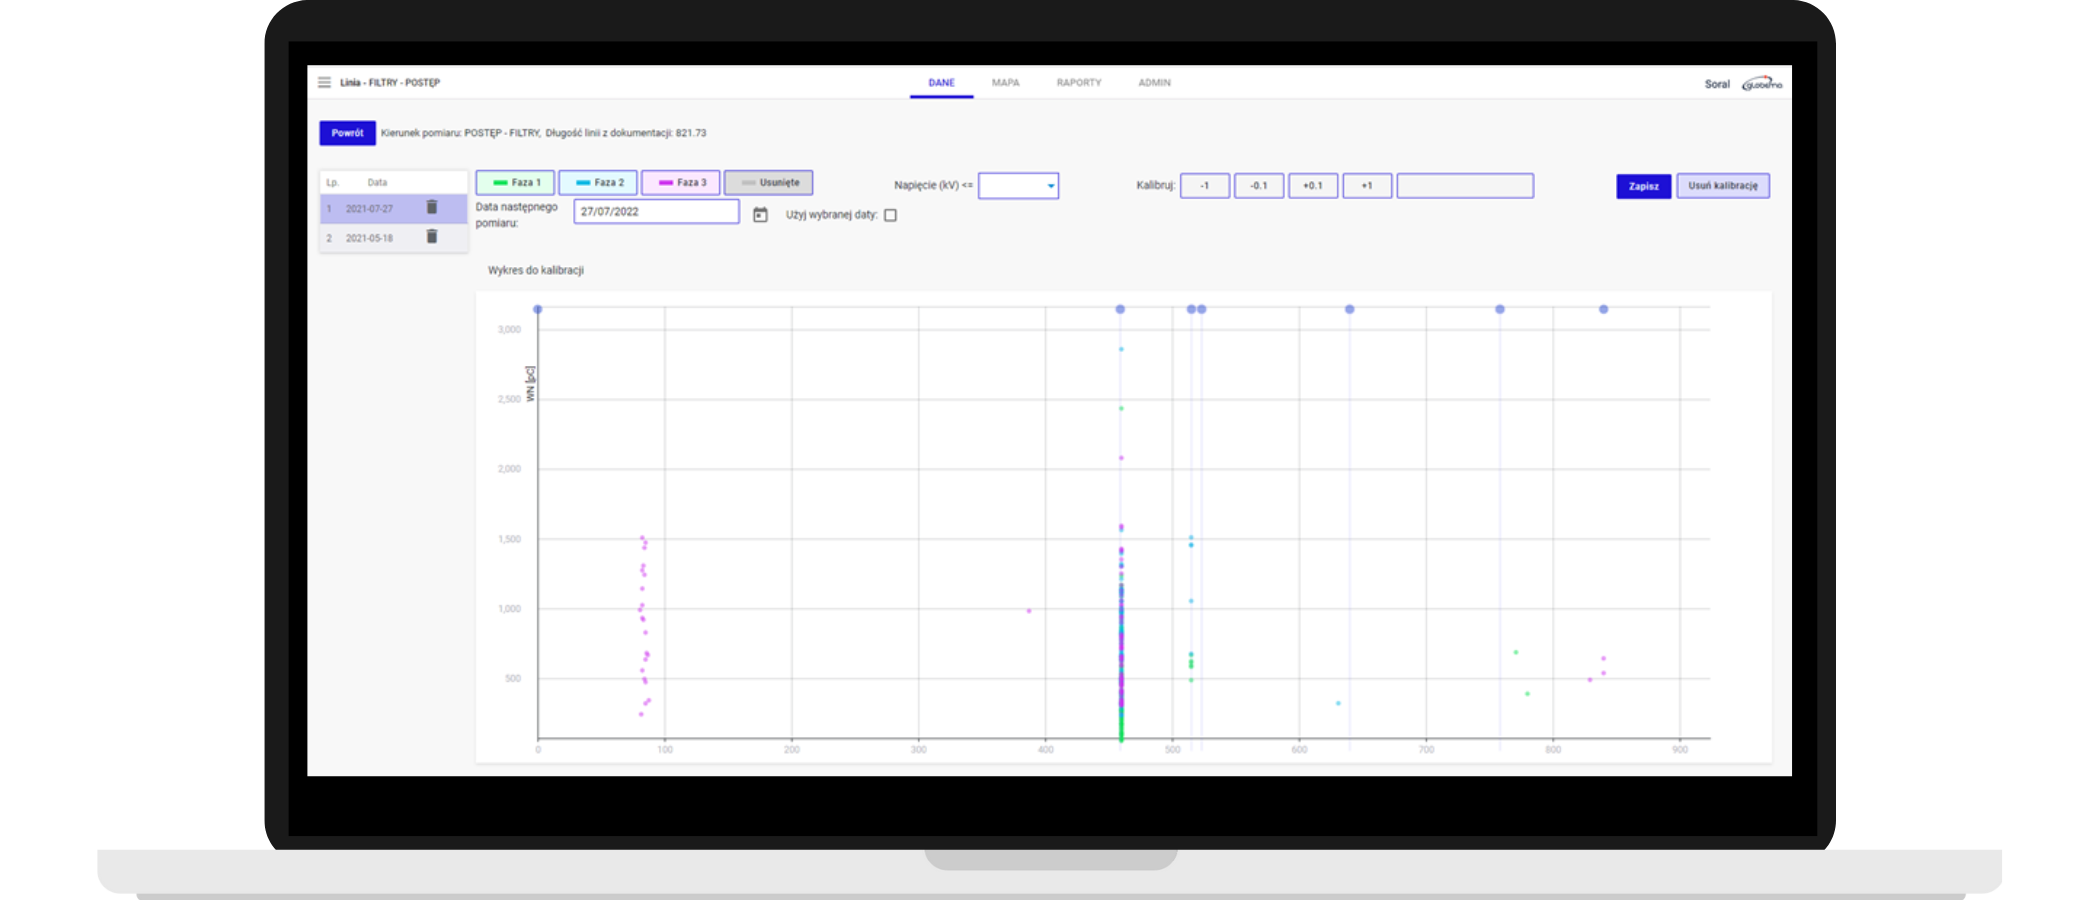
Working with measurement vehicles
SORAL prepares initial data files for diagnostics, reducing the necessary preparation for field inspections. Then, it utilizes measurements to calibrate the network segment length and evaluates their conditions.
Financial benefits of SORAL
Expected financial benefits of using the system include two areas: limiting outages and optimizing investment and modernization expenditures.
Reducing the number of outages by about 25% a year:
- on average, there are 80 outages per 1000 kilometers of cable lines a year
- an average cost of fixing an outage is about 800 EUR
16500
Financial benefits per 1000 kilometers of used lines
Limiting investment and modernization expenditures by about 2,5% a year:
- average yearly spending is 1.24 million EUR per 1000 kilometers of cable lines
31000
Financial benefits per 1000 kilometers of used lines
Depending on cable network condition, the financial benefits of using SORAL range from 41k to 51k EUR per 1000 kilometers of used cable lines a year.
51000
per 1000 kilometers of cable lines a year
What are the other benefits of SORAL?
Lowers operation costs
by reducing the number of outages and repairs
Saves investment resources
through limiting investments to only network segments at high risk of causing an outage
Reduces the number of energy disruptions
caused by network outages
Increases the quality of distribution services and customer satisfaction through improving SAIDI and SAIFI metrics
(SAIDI - System Average Interruption Duration Index, SAIFI - System Average Interruption Frequency Index)
Why should you use our experience?
- For many years we’ve been maintaining fruitful cooperations with leading operators in the energy industry in Poland and abroad
- Since 2012 we have maintained a Research & Development Center status granted by the Polish Ministry of Development. We actively run research & development projects using modern technologies such as Artificial Intelligence and Machine Learning. We implement our findings at companies around the world
- We have a portfolio of original and custom solutions and services that leverage AI/ML for different industries, including energy
Our energy sector solutions are trusted by: