

Case Study TAURON
Introduction
Globema’s solution helped to forecast the production and consumption of energy from renewable sources. It allowed TAURON Group (which includes TAURON Ekoenergia and TAURON Sprzedaż) to achieve its goals – it is now able to more accurately predict the share of energy from renewable sources in the national energy balance. Learn more about the TAURON Group’s success story.
Contents:

Industry: Energy
Country: Poland
Solution: Forecasts of energy production from renewable sources
Category: Forecasting energy production and consumption
TAURON Group is the key entity in the energy industry and an important part of the energy safety system in Poland. The Group is the biggest energy distributor and one of the largest business entities in Poland. It operates on around 18% of the country’s area.
Dynamic growth of prosumer energy
In Poland, 2021 was the year of a particularly fast power increase in photovoltaic installations. This increase, in comparison to the previous year, reached 192%. According to the Polish Energy Market Agency, at the end of November 2021, installed wind energy power exceeded 7.0 GW and photovoltaic power was over 7.1 GW. This included 5.1 GW from about 750k prosumer installations.
Increase in the number of photovoltaic installations
Photovoltaics make up 42% of installed RES power in Poland. In October 2021, Polish power plants generated nearly 16 TWh of energy, including about 3.5 TWh from RES.
With such large volumes, it’s obvious that there is a need for forecasting the RES energy share in the national energy balance. This is true both for energy traders and Distribution System Operators (DSOs).
A systematic increase in the number of low-power installations scattered in the field resulted in a demand for an area-based approach to forecasting. This ensures acceptable costs of forecasts while minimizing errors and maximizing credibility.
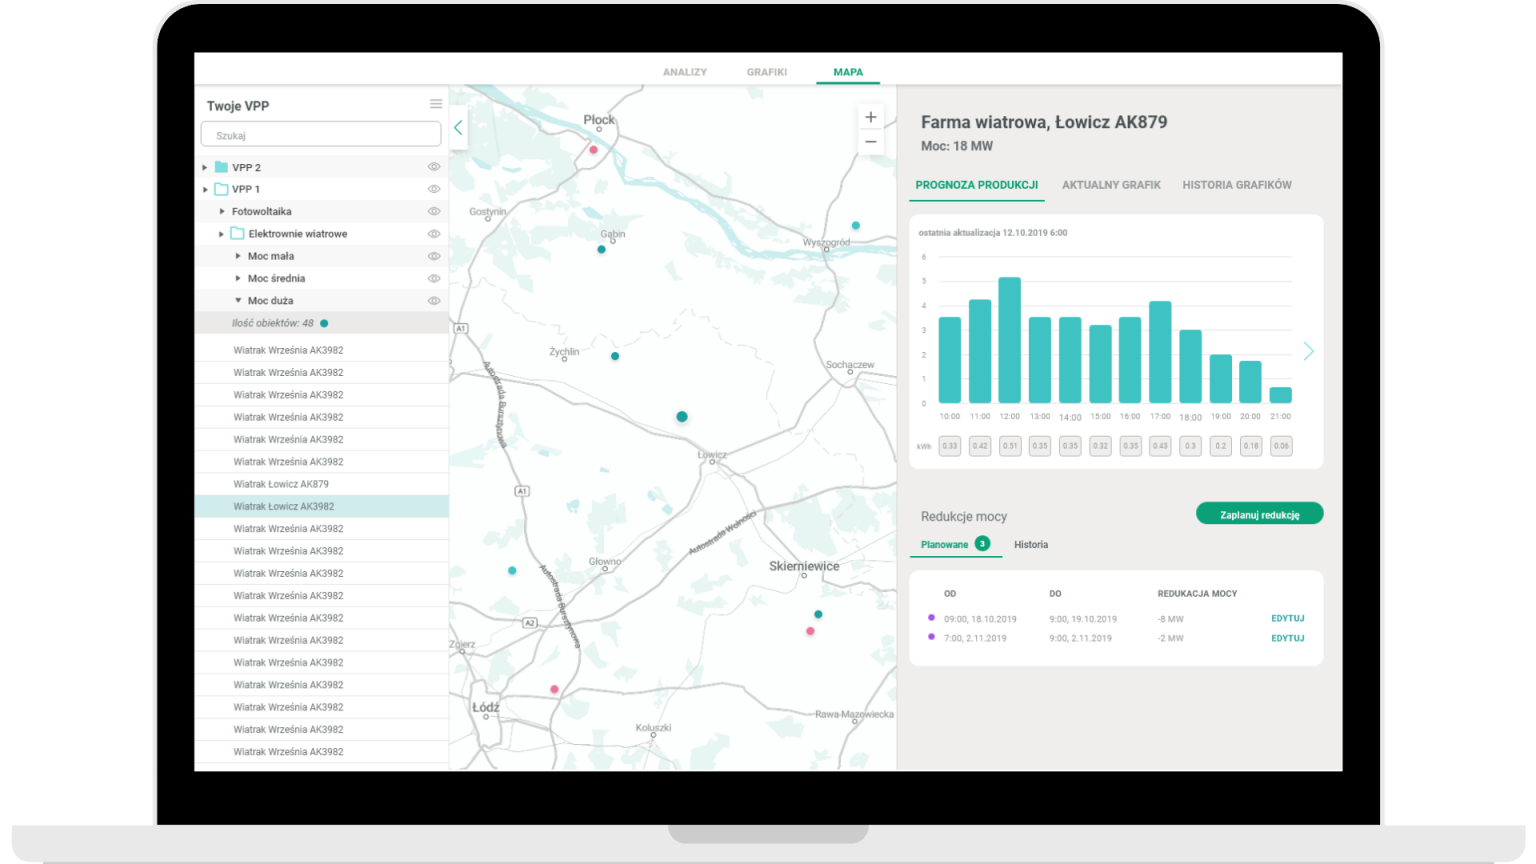
Area-based forecasting of energy production treats individual energy producers as one Virtual Power Plant (VPP). The topological structure of energy networks as well as a need for minimizing forecast errors are some of the reasons why particular energy sources get to be included in a VPP.

Prosumers in the TAURON Group
TAURON Group consists of autonomous companies, such as TAURON Ekoenergia producing energy from renewable sources, and TAURON Sprzedaż (Sales) selling energy to over 5.6 million customers. Over 300k prosumer installations are connected to TAURON’s distribution grid. Additionally, in 2021, TAURON Dystrybucja (Distribution) connected 89 renewable energy sources other than installations with a power of less than 50kW to the grid. Their total power equals 123.959 MW. Most of these RES are solar farms – there are 79 of them and their power totals 66.455 MW.
Prosumer installations with the power of up to 50 kW are connected to the TAURON Dystrybucja grid and scattered throughout the following voivodeships: Lower Silesian, Opolskie, Silesian, and Lesser Poland. TAURON Sprzedaż functions as a seller for all prosumers from these provinces. The company is obliged to settle transactions according to the law related to RES.

Challenge
TAURON Ekoenergia together with TAURON Sprzedaż were planning a project related to prosumer energy production.
The project tasks were related to forecasting and evaluating the operation of micro sources (of less than 50kW power).
The goal was to propose algorithms forecasting the demand and production of prosumer energy in the area-based arrangement. It was dedicated to the customers of TAURON Sprzedaż.
TAURON Sprzedaż is an entity that is required by law to handle the trade of the largest volume of energy generated by prosumers in the Polish energy market.
According to the Polish Energy Regulatory Office – URE, the total prosumer energy in the TAURON Dystrybucja grid in 2021 equaled 875 560 MWh. In 2020 it was 366 042 MWh, in 2019 – 101 670 MWh, and in 2018 – 39 757 MWh. Such a dynamic increase in prosumer energy in the TAURON Dystrybucja grid makes evident the scale of prosumer growth over the past few years.

All this shows how important it is for TAURON to search for effective methods for forecasting the amount of energy produced and consumed by prosumers.
The challenge was not only related to the forecasting itself. It also required finding a solution for predicting two parameters: energy production and consumption. The information about these parameters was related to the energy flow within the distribution grid. DSOs measurements don’t include data about the amount of energy generated by particular photovoltaic installations. Therefore, it was crucial to find an approach that would allow the company to minimize forecast errors.
2021 in TAURON
875560
energy introduced to the TAURON Dystrybucja grid by prosumers
124
installed capacity of RES (other than installations below 50 kW)
66
installed capacity in solar farms
Solution
We proposed two different approaches to forecasting energy demand and production.

The first approach was related to forecasting energy demand. It was based on profiles of existing electricity tariffs defined by TAURON Dystrybucja and included in the Instructions of Distribution Grid Operations and Maintenance (IRiESD).
In this project, electricity tariffs were dedicated to prosumers located in the analyzed areas. We only possessed collective measurements that contained data about energy production and consumption in a given area within one-hour intervals. For this reason, we determined area-based substituting profiles. They were based on percentages of installations from particular tariff groups in given areas as well as average annual energy usage in each group.
We also needed to consider the dynamics of the increase in the number and power of prosumer installations. In our research, we determined these values using time and area interpolation based on collected historical data. In our example, the areas were pre-established by collective measurements but ultimately, they will be identified as smaller territorial units to achieve more precise results.


The second approach was related to forecasting energy production which was performed based on areas and weather parameters. In this case, areas were determined in a way that ensured as stable weather conditions as possible.
We proposed counties as an optimal territorial unit that accumulates prosumer installations. This way we created a rough map with the spatial distribution of installed PV power of prosumers. This distribution was a foundation for forecasting energy production based on solar radiation flux density, air temperature, panel technical properties, and data describing their orientation: inclination and direction.
Particular weather parameters were subject to spatial distribution and energy production forecasts and they were prepared at a one-hour interval. Just like we did before, we considered the dynamics of installation growth and in comparison to the energy demand, we matched counties with areas for which we had collective measurements.

The entire process described above can be divided into two phases:
1st Phase
where we determine constant or slowly-changing data and areas for analysis
2nd Phase
that includes the operational production and consumption forecasting for a given area within the next days
Results and future plans
Based on prosumer production forecasts and estimations of their consumption, we determined the balance difference and we compared it with the collective measurements of areas. We received errors of 5% to 19% depending on the area and month. They were the average absolute deviation normalized by the amplitude of the monthly energy balance.
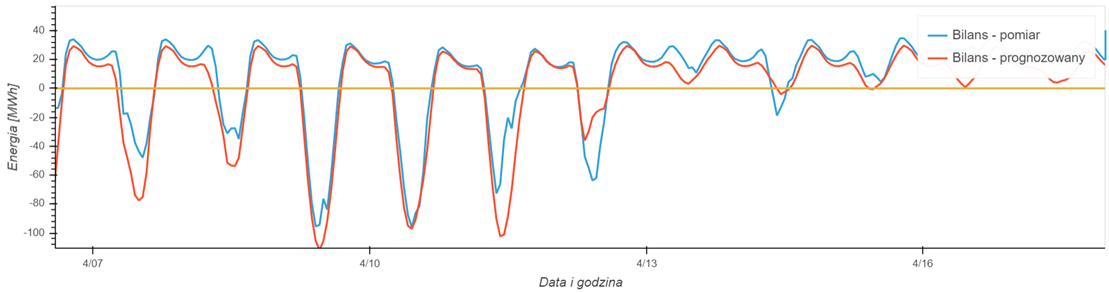
Our experience from other projects related to area-based forecasting of PV energy production tells us that this type of error ranges from 2% to 6%. An increase in deviations above 6% can be a result of an inaccurate determination of prosumer consumption so this is an area that we expect to improve significantly.
We identified several reasons for this situation, including:
- a switch in customer behavior after installing their own PV panels that implies a greater energy usage,
- a lack of profiles prepared for prosumer groups,
- observed anomalies in the energy exchange balance,
- too much measurement data aggregation, both in terms of areas and groups,
- prosumer consumption that is difficult to determine using statistical methods in the B and C tariffs.

Despite the limitations mentioned above, the forecast results are very promising and the conclusions that we draw after completing the project have set directions for further work. It could begin with low-cost operations, such as greater area atomization for a more precise spatial distribution of the installed power. Then we would include this power’s real-time variability based on data from the billing system and start researching the more precise values of prosumer consumption in particular tariff groups.
This is possible by carrying out a detailed measurement data analysis for representative groups in B and C tariffs as well as conducting research based on the control sample. The control sample would need to consist of the same number of clients in the G (household) tariff with similar characteristics, some owning RES installations and some not.
Benefits for TAURON
Other than the data we mentioned above, the comparison of numbers of prosumers also visualizes the scale of the dynamic growth of prosumer energy in TAURON Group’s service areas. In 2020, TAURON had 142.512 prosumers and at the end of 2021, almost twice as many – 268.395. Therefore, using forecasting methods that allow TAURON to optimize predictions about energy both produced and consumed by the prosumers is crucial for the Group.
Unique solutions proposed by Globema make it possible to compare the results of this new method with the outcomes of forecasting solutions used at TAURON in the past. Moreover, some of the recommendations given by Globema were so interesting for the Group, that they will be implemented in the forecasting system used by TAURON Sprzedaż. The company will implement the method for dividing PV production areas into smaller units.
Summary
Implementing models proposed by Globema and the result analysis of different control parameters for these models resulted in a better understanding of the phenomena related to prosumer energy at TAURON. Moreover, the Group noticed an increase in the know-how related to modeling these phenomena. The finished project expands the range of available forecasting models that can be used for predicting energy demand in areas with dynamic growth of prosumer installations. This recently acquired experience should help improve the accuracy of energy demand forecasting.
For Globema, it was a great opportunity to develop skills related to forecasting energy from small, scattered RES using an area-based approach.

Discover other success stories
Tradea
More profits with reliable forecasts of energy production from renewables
Learn how Globema helped to reduce Tradea’s balancing market participation costs thanks to reliable weather forecasts provided for 250 distributed solar and wind energy sources.
Polenergia
Network inventory supports Polenergia’s growth based on M&A
Learn how we standardized the network management at one of the largest energy distributors in Poland and organized data about 30 areas covering 11 thousand customers.


